Investment & Operations Model
Connecting design data, regional costs, revenue assumptions, and scenario testing in one structured decision workflow.
A browser-based decision-support product for evaluating the economic feasibility of tourism, urban renewal, and mixed-development proposals during the early design stage.
Product definition, workflow design, information architecture, business logic, implementation
Browser application (desktop-first workstation)
CSV, XLSX, XLS, JSON, and regional economic index parameters
verified_user Independent product · Copyright application in progress

Early design decisions already have economic consequences.
Design area, development cost, sales price, operational use, non-revenue space, and regional assumptions are often stored in separate files or evaluated through disconnected spreadsheets. This makes it difficult to understand how a spatial design change affects investment scale, revenue trajectory, payback horizon, and overall feasibility.
Fragmented Spreadsheets
Design teams export CAD/GIS area tables while commercial consultants build isolated Excel models with obscure cell formulas that instantly break whenever spatial footprints are shifted.
Opaque Multi-Variable Dependencies
It is virtually impossible to trace how reducing public plaza area by 15% directly influences land value capture versus operational foot traffic, hospitality RevPAR, and municipal subsidy rights.
Late Feasibility Discovery
Economic unfeasibility is often uncovered weeks after architectural masterplans are drafted, forcing reactive value engineering that strips architectural character and degrades masterplan intent.
Lost Iteration History
Teams struggle to remember why specific regional cost benchmarks were picked, what discount rates were agreed upon with clients, or how an alternative proposal compares against the baseline.
Translate fragmented spreadsheet calculations into a transparent, repeatable decision workflow connecting spatial design with scenario-based economic evaluation.
Accept non-standard architectural area schedules and canonicalize them automatically.
Keep regional parameters, cost indexes, and escalation rates visible and inspectable at every step.
Branch baseline proposals to test price sensitivity, density tradeoffs, and capital constraints.
End-to-End Decision Architecture
Create a transparent and repeatable path from imported design data to scenario-based economic evaluation. The 9-stage sequence guarantees computational rigor without turning into a black box.
Project Setup
Establish site boundary coordinates, land acquisition baseline, planning horizon, and designated mixed-use asset types.
Design Data Import
Ingest raw CSV, XLSX, or JSON schedules generated by Revit, Rhino, or manual architectural quantification tables.
Area Ledger
Normalize gross floor area (GFA), net leasable area (NLA), operational footprints, and non-revenue community realms.
Regional Parameters
Apply localized cost indices, city-tier construction premiums, municipal financing benchmarks, and inflation deflators.
Investment & Revenue
Synthesize phase-by-phase CapEx outlays with projected residential sales, hotel RevPAR ramps, and lease cashflow curves.
Socioeconomic Impact
Project direct construction labor, permanent service jobs, multiplier-based regional GDP contributions, and tax yields.
Feasibility Check
Evaluate against static payback target periods, unlevered ROI hurdle rates, and maximum allowable debt service ratios.
Scenario Iteration
Test real-time adjustments across pricing, utilization, asset mix, and phasing while retaining versioned comparison branches.
Report Output
Generate executive decision briefing cards, auditable calculation appendices, and client-ready financial proposal PDFs.
Key Design Choice Points
Editorial examination of foundational trade-offs resolved during product architecture. Every decision balanced mathematical flexibility against governance and clarity.
Build another spreadsheet - or build a guided product workflow?
Situation: Spreadsheets provide limitless computational flexibility, but their business logic inevitably dissolves into hidden formulas, hardcoded cells, and unverifiable assumptions when passed between design and development teams.
Decision: The model decomposes the decision problem into distinct stages: project setup, design data import, regional parameters, calculations, feasibility checks, iterations, and reporting. Users can inspect and adjust inputs at designated checkpoints without corrupting the downstream mathematical engine.
“Make the decision process visible, not only the final number.”
Scattered cells, hidden logic, nested IF/VLOOKUP chains, unversioned copies named v4_final_edit.xlsx.
Deterministic linear pipeline with explicit parameter inputs, auditable calculations, and snapshot scenario versioning.
Require a rigid template - or support messy real project data?
Situation: Architectural space programs arrive in dozens of incompatible formats: diverse column headers (GFA vs Gross Area vs Built Area), messy units, multilingual labels, and nested category rollups.
Decision: Instead of forcing partners to manually conform to an inflexible template, the platform accepts CSV, XLSX, and XLS formats and introduces an interactive boundary field-mapping interface. A reference schema is provided, but never enforced as the sole ingestion gateway.
“Adapt at the boundary; standardize inside the system.”
Return one static result - or support iterative decision-making?
Situation: Most financial templates produce a single static bottom line. When an early-concept scheme fails hurdle rates, designers don't know whether to cut architectural quality, adjust commercial allocation, or lobby for density bonuses.
Decision: The system continuously benchmarks scenarios against target payback periods and minimum ROI thresholds. When an initial scheme falls short, users can test changes in selling price, utilization, construction cost, and non-revenue space while preserving a synchronized ledger of every iteration.
“A decision-support product should reveal what can change.”
Automate the model completely - or keep assumptions understandable?
Situation: Excessive AI or black-box financial scripting creates mistrust among senior planning directors and investment review committees who need to defend figures in municipal hearings.
Decision: Calculations are fully automated, but all regional parameters, multipliers, discount rates, and operational benchmarks remain visible, inspectable, and editable. The model explicitly frames outputs as planning-stage feasibility estimates rather than speculative final accounting.
“Trust comes from observable inputs and inspectable logic.”
- check Every formula can be inspected via hover tooltips.
- check Parameters can be overridden with documented notes.
- check No unexplainable heuristic or hidden fudge factor.
The Decision-Support Experience
Nine dedicated workstation views structured for transparency, auditability, and speed. Built to empower architects, financial analysts, and municipal clients in synchronized workshops.

Project Setup
Establishes site coordinates, spatial bounds, development duration, and initial asset classifications across mixed-use typologies.

Import & Field Mapping
Fuzzy header matching resolves varied architectural column nomenclature to canonical system data objects with manual override.
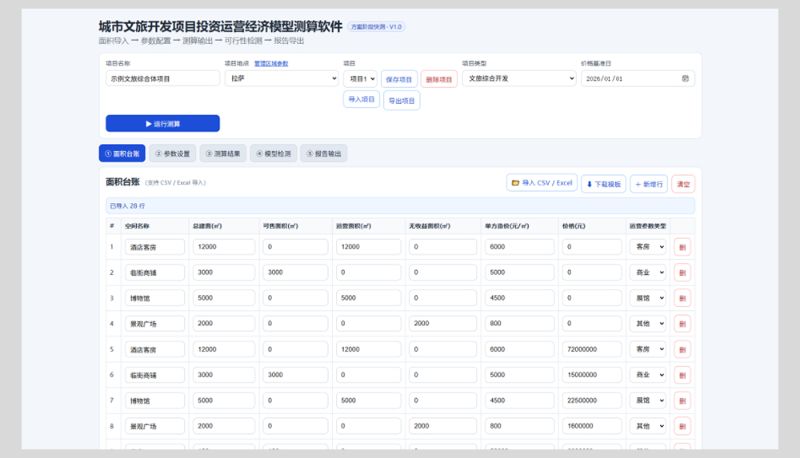
Area Ledger
Centralized register auditing gross, leasable, circulation, and civic non-revenue floor areas with ratio health checks.

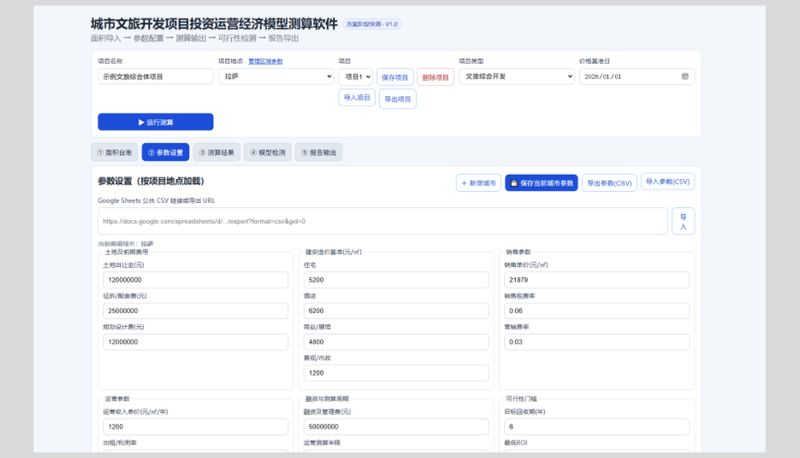
Regional Parameters
Localized construction benchmarks, cost indexes, and land price adjustments matched to provincial market dynamics.
Investment & Revenue
Dynamic multi-year phasing engine separating upfront capital expenditure from phased hospitality and retail leasing income.

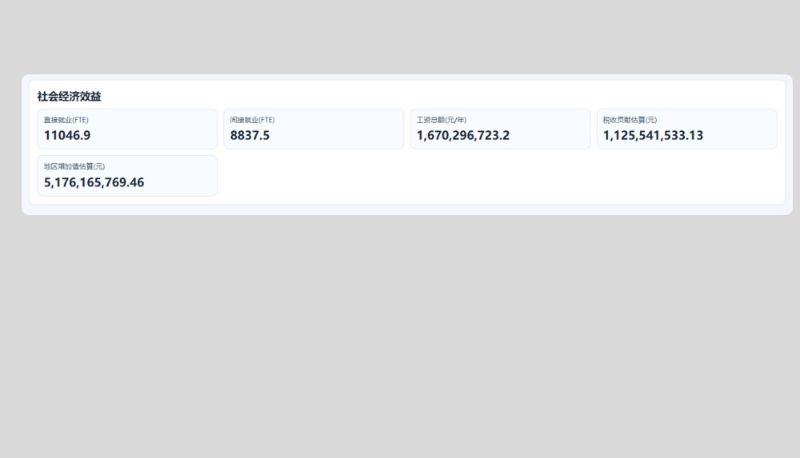
Socioeconomic Estimates
Derived labor job generation, direct/indirect supply chain benefits, and municipal tax contribution estimations.
Feasibility Status
Instant visual threshold status reporting with sensitivity dials showing distance to project failure gates.

Scenario Iteration History
Side-by-side comparative ledger displaying parameter deltas, spatial variances, and yield improvements.

Report Preview & Output
Produces executive decision memos, printable diagnostic summaries, and transparent underlying calculation traces.
Key Output Metrics
A restrained metric architecture highlighting planning indicators without fabricated figures, focusing on decision-critical parameters that guide investment committees.
Total Project Investment
Synthesizes land acquisition, baseline construction, regional cost index multipliers, professional services, and contingency allowances into a phased capital ledger.
Sales & Disposition Revenue
Estimates upfront capital recovery via phased residential, commercial office, and retail unit pre-sales, reflecting local absorption rates and market price schedules.
Operational Cash Flow
Projects ongoing net operating income (NOI) from ticketed cultural assets, retail leasing rents, food & beverage licenses, and hospitality RevPAR ramp curves.
Static Payback Period
Identifies the breakeven year at which cumulative operating revenues and asset disposition proceeds fully recover cumulative initial capital investment.
Cumulative Net Cash Flow
Traces year-over-year liquidity balances over a 15-to-20 year planning horizon to reveal peak capital deficit exposure and financing maturity windows.
Return on Investment (ROI)
Calculates unlevered project yield compared against public-private partnership (PPP) benchmark targets and institutional risk-adjusted capital hurdle rates.
Direct & Indirect Employment
Translates development volume and ongoing tenant operational floor areas into short-term construction labor and permanent commercial service headcounts.
Regional Value-Added
Projects municipal tax receipts, secondary tourist supply-chain expenditures, and municipal gross product contributions generated across project lifecycle.
Outcome & Tangible Impact
The product turns dispersed design and economic inputs into a repeatable workflow for comparing alternatives, testing assumptions, and communicating feasibility during the proposal stage.
Working Decision Platform
Delivered an operational, browser-based feasibility engine featuring instant CSV/XLSX schema harmonization, real-time parametric scenario evaluation, and dynamic cashflow curves.
Deterministic Audit Trail
Every parameter change generates an immutable branch snapshot. Architectural and financial teams can justify design modifications to government officials with complete calculation transparency.
Bridged Discipline Gap
Unified physical spatial layouts with financial modeling into a shared vocabulary. Planners instantly see the financial yield of adding park space; financiers understand physical density constraints.
Reflection & What's Next
Critical assessment of the product's ongoing evolution, usability across cross-functional roles, and the roadmap toward team-wide governance.
Assumption Comprehension
Design directors and financial analysts process data differently. Continued user testing is focused on refining assumption summaries so non-financial stakeholders can intuitively grasp complex discounting models without losing trust.
Multi-Alternative Comparison
While two-way A/B scenario checks are fast, investment committees frequently evaluate 4 to 6 competing masterplan concepts simultaneously. Developing an n-way synchronized matrix view will streamline committee deliberations.
Data Provenance & Confidence
Early masterplans inherently rely on imperfect cost data. Integrating statistical confidence intervals (±12% range envelopes) and clear data source lineage will help teams communicate risk without false certainty.
Collaborative Governance
Exploring multi-user role permissions where lead design architects control spatial programs, cost estimators control benchmark coefficients, and partners retain final sign-off locks before client presentation.
Web Experience System
A synthesis of 20+ responsive web experiences across professional services, wellness, photography, creative studios, and personal brands.